最近更新于 2025-08-15 20:13
1 心形线
\begin{array}{l}
\rho=a(1-\cos\theta)(a>0,\theta\in[0,2\pi]) \\
\\
x^2+y^2+ax=a\sqrt{x^2+y^2}(a\gt0)\\
\\
\begin{cases}
x=a(1-\cos\theta)\cos\theta \\
y=a(1-\cos\theta)\sin\theta
\end{cases}
(a>0,\theta\in[0,2\pi])
\end{array}
import matplotlib.pyplot as plt
import numpy as np
alpha = 1
theta = np.linspace(0, 2 * np.pi, 100)
rho = alpha * (1 - np.cos(theta))
plt.polar(theta, rho, color='r')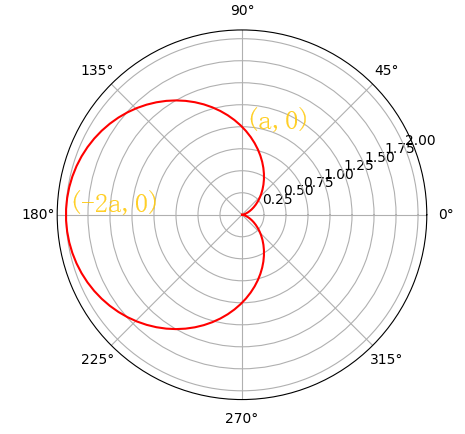
\begin{array}{l}
\rho=a(1+\cos\theta)(a>0,\theta\in[0,2\pi]) \\
\\
x^2+y^2-ax=a\sqrt{x^2+y^2}(a\gt0)\\
\\
\begin{cases}
x=a(1+\cos\theta)\cos\theta \\
y=a(1+\cos\theta)\sin\theta
\end{cases}
(a>0,\theta\in[0,2\pi])
\end{array}
import matplotlib.pyplot as plt
import numpy as np
alpha = 1
theta = np.linspace(0, 2 * np.pi, 100)
rho = alpha * (1 + np.cos(theta))
plt.polar(theta, rho, color='r')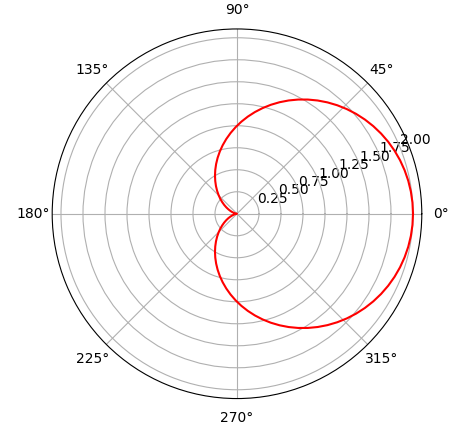
\begin{array}{l}
\rho=a(1-\sin\theta)(a>0,\theta\in[0,2\pi]) \\
\\
x^2+y^2+ay=a\sqrt{x^2+y^2}(a\gt0)\\
\\
\begin{cases}
x=a(1-\sin\theta)\cos\theta \\
y=a(1-\sin\theta)\sin\theta
\end{cases}
(a>0,\theta\in[0,2\pi])
\end{array}
import matplotlib.pyplot as plt
import numpy as np
alpha = 1
theta = np.linspace(0, 2 * np.pi, 100)
rho = alpha * (1 - np.sin(theta))
plt.polar(theta, rho, color='r')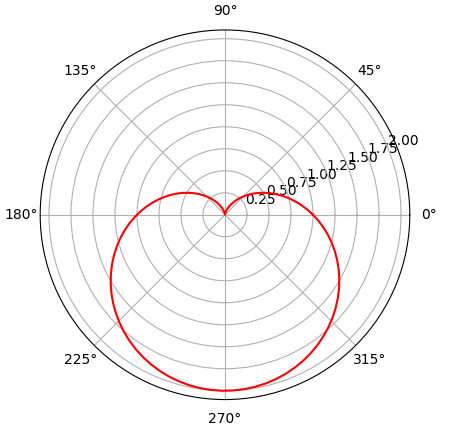
\begin{array}{l}
\rho=a(1+\sin\theta)(a>0,\theta\in[0,2\pi]) \\
\\
x^2+y^2-ay=a\sqrt{x^2+y^2}(a\gt0)\\
\\
\begin{cases}
x=a(1+\sin\theta)\cos\theta \\
y=a(1+\sin\theta)\sin\theta
\end{cases}
(a>0,\theta\in[0,2\pi])
\end{array}
import matplotlib.pyplot as plt
import numpy as np
alpha = 1
theta = np.linspace(0, 2 * np.pi, 100)
rho = alpha * (1 + np.sin(theta))
plt.polar(theta, rho, color='r')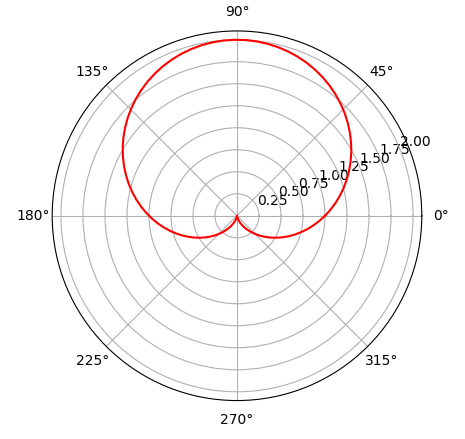
2 阿基米德螺线
\begin{array}{l}
r=a\theta(r\gt0,\theta\ge0)(a\gt0,\theta\in[0,+\infty)) \\
\\
\begin{cases}
x=a\theta\cos\theta \\
y=a\theta\sin\theta
\end{cases}
(a\gt0,\theta\in[0,+\infty))
\end{array}
import matplotlib.pyplot as plt
import numpy as np
alpha = 1
theta = np.linspace(0, 2 * np.pi, 100)
rho = alpha * theta
x = rho * np.cos(theta)
y = rho * np.sin(theta)
plt.axis('equal')
plt.plot(x, y, color='r')
plt.axhline(y=0, color='k')
plt.axvline(x=0, color='k')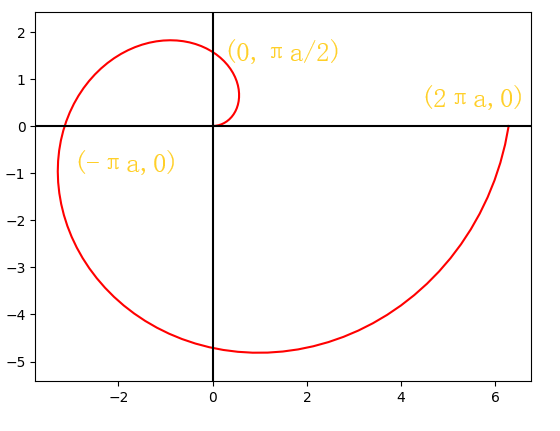
4 伯努利双扭线
\begin{array}{l}
r^2=a^2\cos2\theta(\theta\in[-\frac{\pi}{4},\frac{\pi}{4}]\cup[\frac{3\pi}{4},\frac{5\pi}{4}],a\gt0)\\
\\
(x^2+y^2)^2=2a^2(x^2-y^2)(a\gt0)
\end{array}
import numpy as np
import matplotlib.pyplot as plt
alpha = 1
theta = np.concatenate((
np.linspace(-np.pi / 4, np.pi / 4, 100),
np.linspace(3 * np.pi / 4, 5 * np.pi / 4, 100)
))
rho = alpha * np.sqrt(np.abs(np.cos(2 * theta)))
plt.polar(theta, rho, color='r')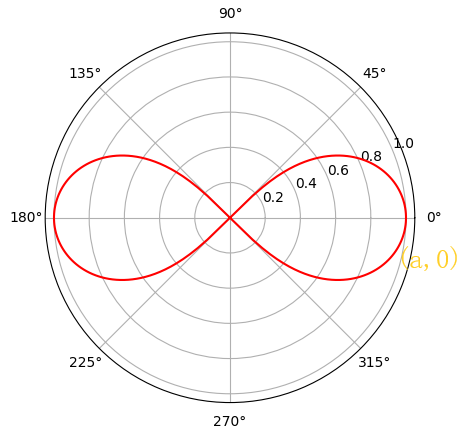
\begin{array}{l}
r^2=a^2\sin2\theta(\theta\in[0,\frac{\pi}{2}]\cup[\pi,\frac{3\pi}{2}],a\gt0)
\\
\\
(x^2+y^2)^2=2a^2xy(a\gt0)
\end{array}
import numpy as np
import matplotlib.pyplot as plt
alpha = 1
theta = np.concatenate((
np.linspace(0, np.pi / 2, 100),
np.linspace(np.pi, 3 * np.pi / 2, 100)
))
rho = alpha * np.sqrt(np.abs(np.sin(2 * theta)))
plt.polar(theta, rho, color='r')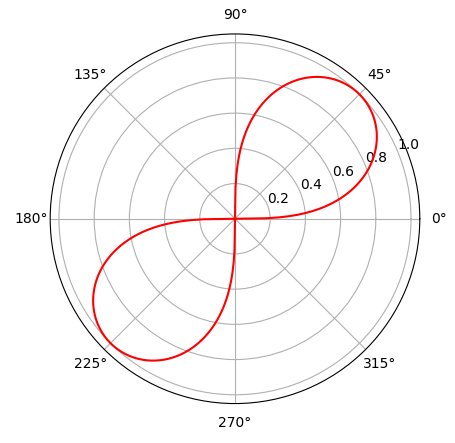
5 摆线
\begin{cases}
x=a(\theta-\sin\theta) \\
y=a(1-\cos\theta)
\end{cases}
(a\gt0)
import numpy as np
import matplotlib.pyplot as plt
alpha = 1
theta = np.linspace(0, 4 * np.pi, 100)
x = alpha * (theta - np.sin(theta))
y = alpha * (1 - np.cos(theta))
plt.axis('equal')
plt.plot(x, y, color='r')
plt.axhline(y=0, color='k')
plt.axvline(x=0, color='k')
plt.axhline(y=2 * alpha, color='b')
plt.axvline(x=np.pi * alpha, color='b')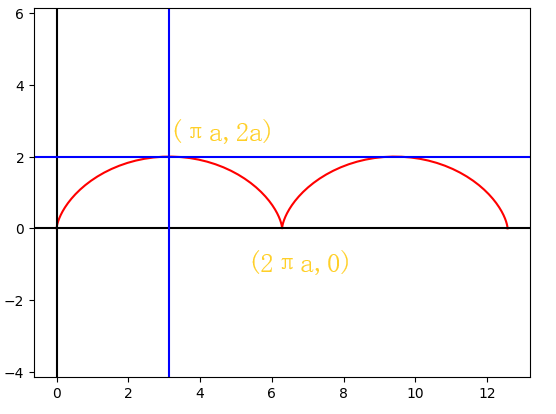
高等数学常用曲线(编辑中)